Data Intelligence Should Contain Intelligent Data: What does AmLaw200 Revenue Data Tell Us?

A couple of charts, published by ALM Legal Intelligence this week, caught my eye and agitated the cynic in me. So much “data” is published on the web and by legal “media” companies, yet so little is properly explained or scrutinized.
The charts purport to analyze the revenue growth (or lack thereof) of the 200 largest US law firms since 2000.
Here are my problems with the charts:
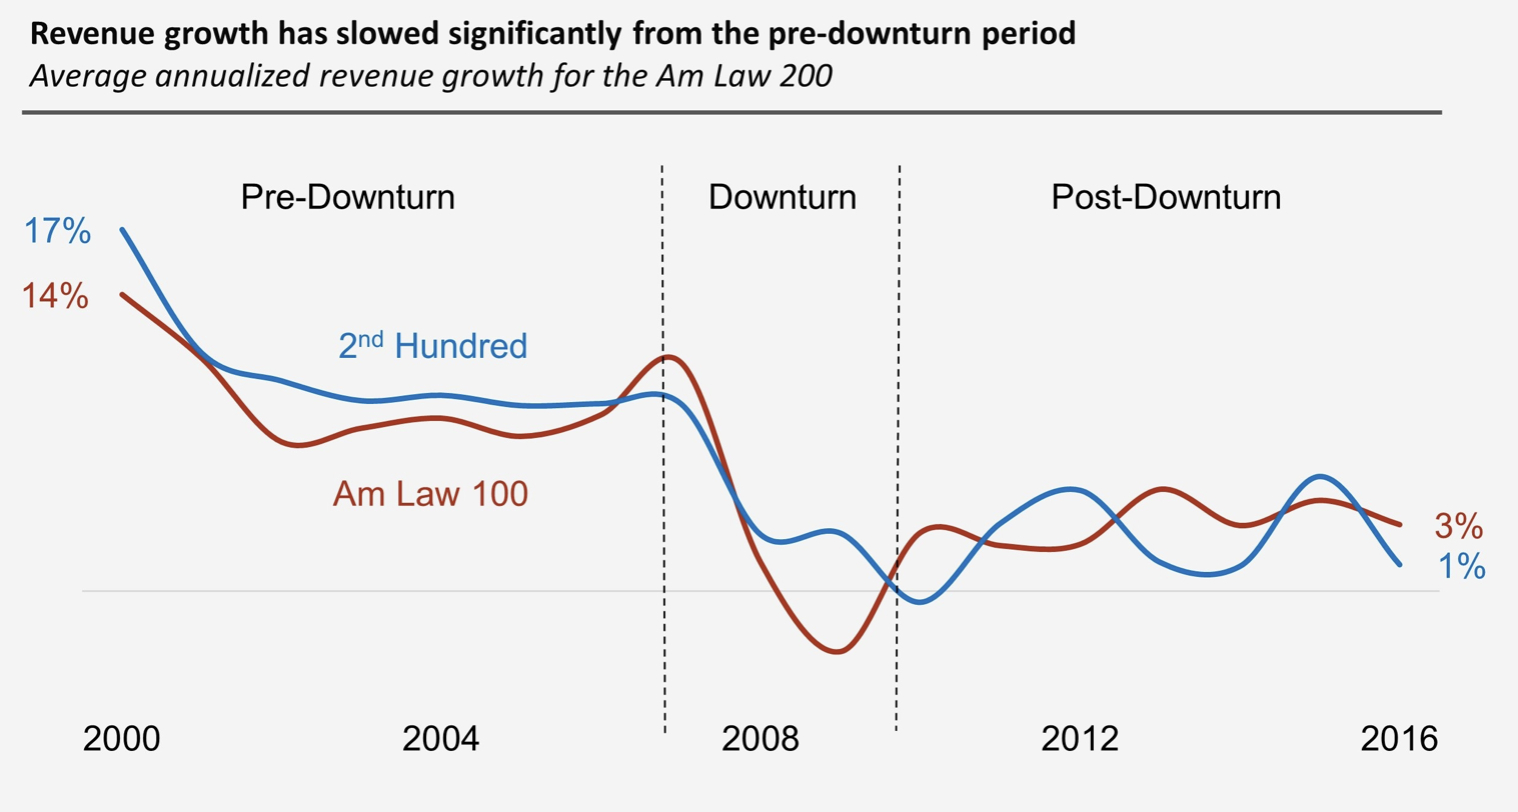
The starting point is entirely arbitrary. In 2000 average growth rates were at 17% and 14% for the AmLaw100 and the “2nd Hundred,” respectively. Doesn’t everyone remember that this was the end of the dot-com boom? If the starting point had been 2002 (right after the hang-overs from that wild party set in), the slow-down in revenue growth would have been much less “significant.” Makes you think of the old adage to only “trust the statistics you manipulated yourself.
Source: ALM Legal Intelligence, https://www.law.com/sites/ali/2018/02/06/alm-legal-compass-snapshot-revenue-growth-trends/
The first chart looks at average revenue growth rates. What does that tell you? I can’t see any value in looking at the average. I wrote about that in the context of law firm performance, Declaring War on Mediocrity: Are We Hiding Performance Potential by Looking at Averages. I don’t know what value anyone garners from looking at averages without understanding how closely firms track it.
Someone will say: “The average is representative of the market,” but that’s not true. Not in this case. There is no “market” called AmLaw200. That is just data ALM Legal Intelligence publishes and - quite obviously - wants to tell everyone that it is relevant. But it’s not. Not as a “market.” Starting with the data you have, and doing analysis of that, is putting the cart before the horse.
Based on the published charts, we can’t tell what “revenue” is. What data source is used? ALM data I assume, but it’s not clear. More importantly though, how are YOY changes calculated? No explanation. But that influences the entire chart.
Source: ALM Legal Intelligence, https://www.law.com/sites/ali/2018/02/06/alm-legal-compass-snapshot-revenue-growth-trends/
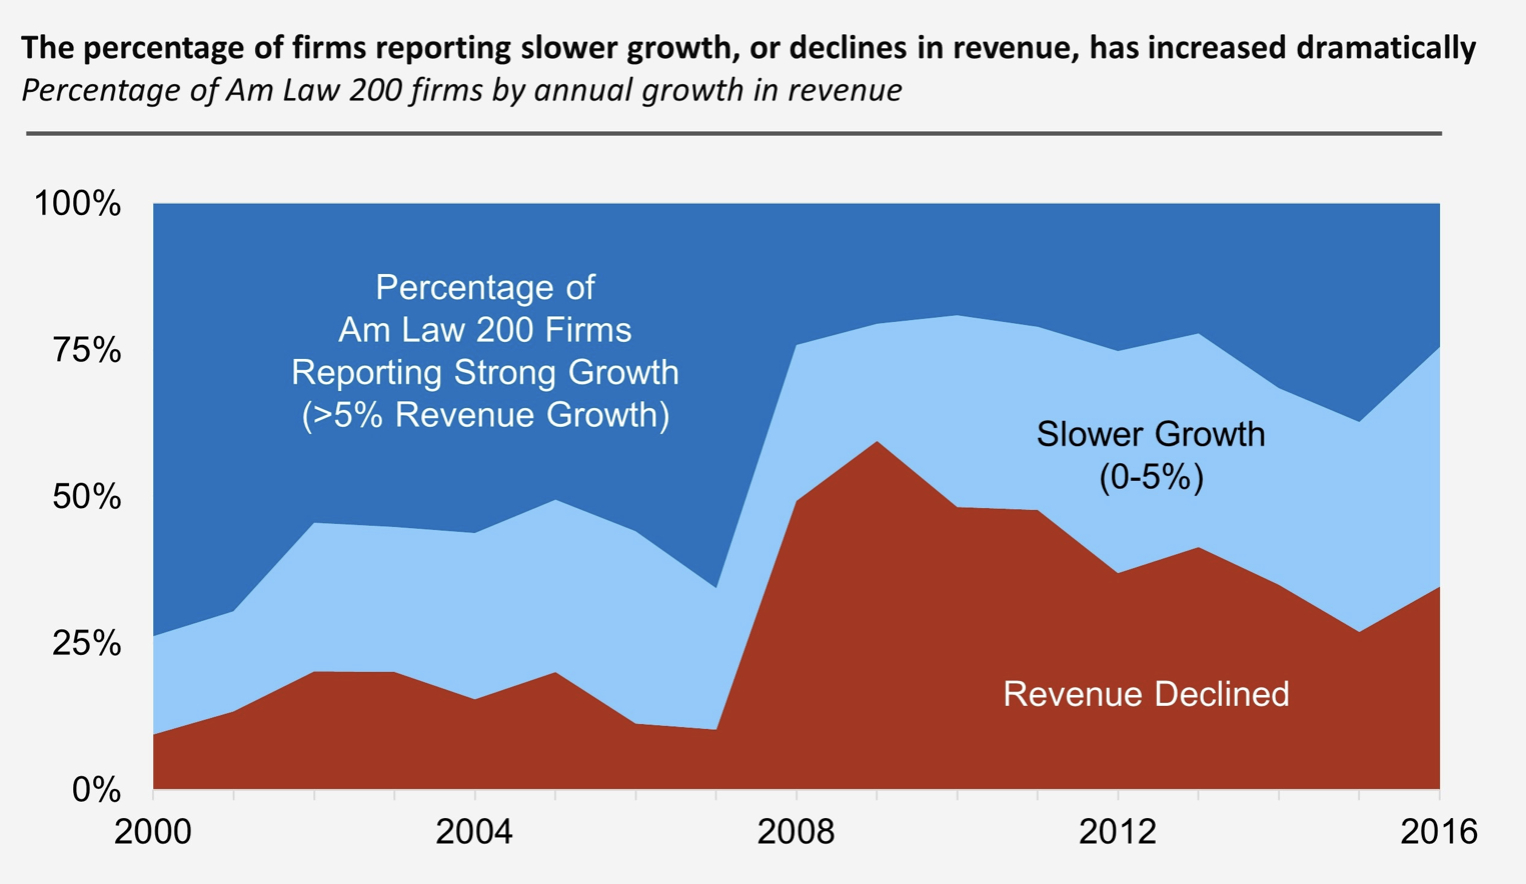
The second chart looks at what percentage of firms (from the AmLaw200 crowd) had strong growth (>5%) vs less strong growth, or a decline in revenue over the last 16 years. That’s colorful and provides an opportunity to quickly recall those go-go years, pre-downtown. But what does it tell you that is of value?
Here’s my problem with the data in the second chart: Does it account for the survivor bias? A lot changes in 16 years, including in the AmLaw200 composition. I haven’t done the diligent exercise of counting the number of law firms that were in the AmLaw 200 in 2000 but now are no longer on that list due to mergers, dissolutions etc. Does a firm like Morgan Lewis that absorbed much of Bingham get listed with strong revenue growth? If it does, then we probably just exaggerated revenue growth. Two AmLaw200 firms merging creates revenue growth in one and a new slot for another. How are that “new” firm’s historic numbers accounted for? The legal market is consolidating (something else ALM Legal Intelligence keeps reporting about). So the survivor bias in the AmLaw200 aggregate numbers is paramount. It is possible that the analyst accounted for all that. But I doubt it. Because it is extremely hard. And it doesn’t make the chart any more valuable. So why do it?
FWIW, I did find something that made me look twice: Do you see that red area under the second chart from 2003 to 2008? There were about 20-30 firms in the AmLaw200 who managed to report decline in revenue during that time. Is that for real? Firms that did not manage to grow during that time? What were they doing? Was management asleep at the wheel? Looking back at those years, one must wonder how that is even possible. But that is an exercise for historians. So let’s move on.